Power Rankings
Updated Mon, Oct 5 · 5:44 PM ET
Every Sleeper roster played through 2026-2027 ten thousand times, averaged with the FantasyPros League Analyzer. 100 is the league average; a point is one percent better.
The schedule ahead - whose helps from here, and which defenses give up points to each position - is on Matchup Strength.
Your League
Power Rankings How this works
Tyler has, through week 3, the strongest roster: 97% playoffs, 32% title (Mark: 21%, 2%).
| Manager | Record | Playoffs | Title | Rating | Move | GordStats | FP | Proj. Record | Luck |
|---|---|---|---|---|---|---|---|---|---|
| 1Tyler | 5-1 | 97% | 32% | 108.1 | +4 | 109.2 | 107.0 | 19.9-8.1 | +0.6 |
| 2Padgett | 4-2 | 69% | 8% | 108.0 | +1 | 98.8 | 117.3 | 14.7-13.3 | +0.4 |
| 3Jackson | 1-5 | 51% | 7% | 106.3 | +1 | 99.0 | 113.6 | 12.8-15.2 | -1.2 |
| 4Colin | 2-4 | 65% | 10% | 106.3 | -2 | 103.3 | 109.2 | 13.9-14.1 | -1.1 |
| 5George | 3-3 | 76% | 13% | 105.2 | -4 | 104.3 | 106.0 | 15.0-13.0 | -0.1 |
| 6Austin | 4-2 | 72% | 10% | 99.6 | +2 | 104.9 | 94.4 | 14.7-13.3 | -0.7 |
| 7Everett | 4-2 | 55% | 5% | 98.4 | -1 | 97.0 | 99.8 | 13.5-14.5 | +0.7 |
| 8Max | 4-2 | 76% | 11% | 94.9 | -1 | 100.6 | 89.2 | 15.5-12.5 | +0.7 |
| 9Trevor | 1-5 | 17% | 1% | 89.4 | · | 91.0 | 87.9 | 9.7-18.3 | +0.3 |
| 10Mark | 2-4 | 21% | 2% | 83.6 | · | 91.8 | 75.5 | 10.4-17.6 | +0.4 |
Move: places climbed since Sep 28. Record includes the weekly median win; Luck is record minus all-play expectation. Played weeks are locked in. Rating averages GordStats (our simulation) and FP (FantasyPros, Oct 5) as ratings, not ranks.
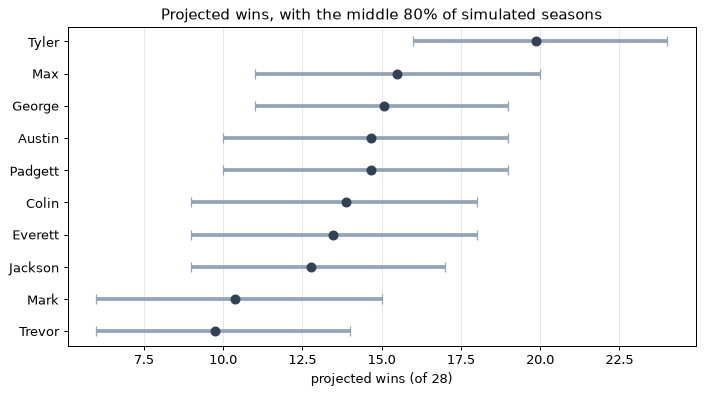
Projected wins range
Dot: average season; bar: middle 80%. Most of these ranges overlap.
Playoff Picture How this works
The top 6 make the playoffs and the top 2 skip the first round. Each team has 22 games left - 11 weeks of a head-to-head game and the median. Nobody has clinched or been knocked out yet; the closest is Tyler, 20 more wins from sure.
| Team | W-L | Magic | Playoffs |
|---|---|---|---|
| 1Tyler | 5-1 | 20 | 97% |
| 2Austin | 4-2 | 21 | 72% |
| 3Max | 4-2 | 21 | 76% |
| 4Everett | 4-2 | 21 | 55% |
| 5Padgett | 4-2 | 21 | 69% |
| 6George | 3-3 | 22 | 76% |
| 7Colin | 2-4 | — | 65% |
| 8Mark | 2-4 | — | 21% |
| 9Jackson | 1-5 | — | 51% |
| 10Trevor | 1-5 | — | 17% |
Seeded as things stand, on wins and then points for: the solid line is the playoff cut, the dashed one the byes. Magic: more wins that clinch a spot whatever anyone else does (losses by the teams chasing can bring it down too); — means the team needs results elsewhere. Playoffs: the simulated chance.
Through the Season
Playoff and title odds How this works
Week by week
| Team | Pre | 1 | 2 | 3 |
|---|---|---|---|---|
| Tyler | 63% | 77% | 86% | 97% |
| George | 67% | 70% | 90% | 76% |
| Max | 53% | 51% | 71% | 76% |
| Austin | 70% | 82% | 85% | 72% |
| Padgett | 61% | 48% | 52% | 69% |
| Colin | 61% | 81% | 63% | 65% |
| Everett | 60% | 39% | 34% | 55% |
| Jackson | 78% | 72% | 58% | 51% |
| Mark | 37% | 55% | 37% | 21% |
| Trevor | 49% | 26% | 25% | 17% |
Week by week
| Team | Pre | 1 | 2 | 3 |
|---|---|---|---|---|
| Tyler | 11% | 15% | 17% | 32% |
| George | 12% | 12% | 21% | 13% |
| Max | 8% | 7% | 11% | 11% |
| Colin | 10% | 18% | 11% | 10% |
| Austin | 13% | 17% | 17% | 10% |
| Padgett | 9% | 6% | 5% | 8% |
| Jackson | 16% | 13% | 8% | 7% |
| Everett | 9% | 4% | 3% | 5% |
| Mark | 4% | 6% | 4% | 2% |
| Trevor | 7% | 2% | 2% | 1% |
Rating, build by build
Since Sep 8: George +7.4, Max -8.6.

This Week's Stakes How this works
Each team's playoff odds with a win and with a loss in week 4. Game of the week, highlighted: Colin vs George.
| Team | Swing | With a win | With a loss | Playoffs now | Win chance | Plays |
|---|---|---|---|---|---|---|
| Jackson | 24 | 63% | 39% | 51% | 53% | Trevor |
| Colin | 22 | 77% | 55% | 65% | 48% | George |
| Everett | 22 | 68% | 47% | 55% | 38% | Max |
| Padgett | 21 | 77% | 56% | 69% | 63% | Mark |
| Max | 20 | 83% | 64% | 76% | 62% | Everett |
| Mark | 20 | 34% | 14% | 21% | 37% | Padgett |
| George | 19 | 85% | 66% | 76% | 52% | Colin |
| Austin | 17 | 83% | 66% | 72% | 36% | Tyler |
| Trevor | 14 | 25% | 11% | 17% | 47% | Jackson |
| Tyler | 4 | 99% | 94% | 97% | 64% | Austin |
Positional Strength
Projected points per game from Sleeper's season projections, filled the way the lineup is: QB, two RBs, two WRs, TE, the best two RB/WR/TE left at FLEX, K and DEF. The bench is the next 1 QB, 2 RB, 2 WR, 1 TE — the depth that would step in. Each bar is the gap to the league average at that position: right of the line is better than average, left is worse. Teams run in power-ranking order in every panel; hover a row for the players.
Whole roster
All starters, and the bench depth below them · avg 121.3, bench 46.6
QB
Starters and the next 1 behind them · avg 18.4, bench 16.3
RB
Starters and the next 2 behind them · avg 28.1, bench 14.3
WR
Starters and the next 2 behind them · avg 29.1, bench 13.9
TE
Starters and the next 1 behind them · avg 11.3, bench 9.0
FLEX
The best two RB/WR/TE left after the starters · avg 22.5
K
The starter · avg 6.3
DEF
The starter · avg 5.5
Show as a table
| Manager | QB | QB bench | RB | RB bench | WR | WR bench | TE | TE bench | FLEX | K | DEF | Starters | Bench |
|---|---|---|---|---|---|---|---|---|---|---|---|---|---|
| 1 Tyler | 18.9 | 15.9 | 31.2 | 16.2 | 28.6 | 13.4 | 13.3 | 0.0 | 20.1 | 6.2 | 5.4 | 123.8 | 45.6 |
| 2 Padgett | 17.4 | 0.0 | 26.5 | 18.0 | 30.7 | 17.6 | 11.8 | 0.0 | 25.9 | 6.5 | 5.6 | 124.5 | 35.6 |
| 3 Jackson | 18.0 | 17.8 | 24.7 | 17.5 | 33.0 | 19.5 | 13.8 | 0.0 | 22.0 | 5.9 | 5.1 | 122.6 | 54.9 |
| 4 Colin | 18.3 | 0.0 | 26.8 | 11.3 | 31.9 | 14.4 | 10.0 | 8.0 | 23.7 | 5.9 | 4.9 | 121.4 | 33.7 |
| 5 George | 21.3 | 17.4 | 30.9 | 9.1 | 26.5 | 19.4 | 11.6 | 9.4 | 22.6 | 6.8 | 5.0 | 124.7 | 55.3 |
| 6 Austin | 19.2 | 16.5 | 24.5 | 15.1 | 28.1 | 4.6 | 10.1 | 10.1 | 21.8 | 6.6 | 6.1 | 116.4 | 46.3 |
| 7 Everett | 17.8 | 16.9 | 27.8 | 19.5 | 28.6 | 7.7 | 10.6 | 0.0 | 22.7 | 6.2 | 6.2 | 120.0 | 44.1 |
| 8 Max | 18.2 | 15.5 | 34.0 | 19.4 | 26.2 | 9.8 | 12.7 | 8.9 | 20.1 | 6.2 | 5.1 | 122.5 | 53.6 |
| 9 Trevor | 17.9 | 16.7 | 31.4 | 8.8 | 27.7 | 20.6 | 10.3 | 9.6 | 23.8 | 6.2 | 5.6 | 122.9 | 55.6 |
| 10 Mark | 17.6 | 13.9 | 22.7 | 8.1 | 29.6 | 11.6 | 9.3 | 8.3 | 22.3 | 6.6 | 6.1 | 114.2 | 41.8 |
Draft Rankings (frozen)
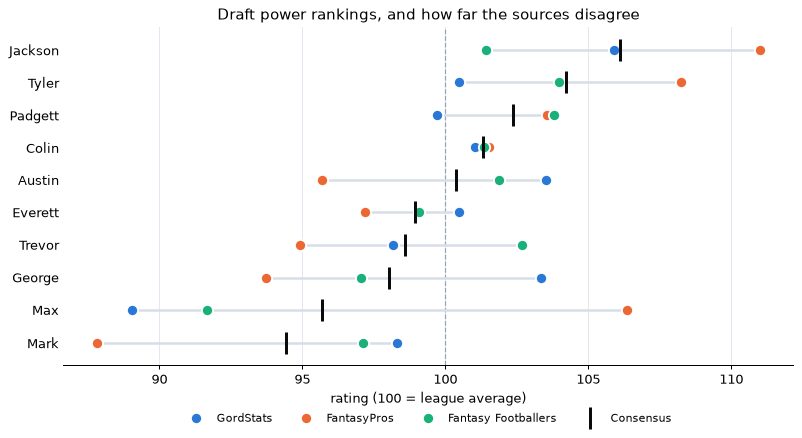
All three sources on draft-week rosters, frozen August 28, 2026. Widest disagreement: Max, 17 points.
| Manager | Consensus | GordStats | FP | FF | GordStats # | FP # | FF # |
|---|---|---|---|---|---|---|---|
| 1Jackson | 106.1 | 105.9 | 111.0 | 101.4 | 1 | 1 | 9 |
| 2Tyler | 104.2 | 100.5 | 108.2 | 104.0 | 6 | 2 | 1 |
| 3Padgett | 102.4 | 99.7 | 103.6 | 103.8 | 7 | 4 | 2 |
| 4Colin | 101.3 | 101.0 | 101.5 | 101.3 | 4 | 5 | 5 |
| 5Austin | 100.4 | 103.5 | 95.7 | 101.9 | 2 | 7 | 4 |
| 6Everett | 98.9 | 100.5 | 97.2 | 99.1 | 5 | 6 | 6 |
| 7Trevor | 98.6 | 98.2 | 94.9 | 102.7 | 9 | 8 | 3 |
| 8George | 98.0 | 103.3 | 93.7 | 97.1 | 3 | 9 | 7 |
| 9Max | 95.7 | 89.0 | 106.3 | 91.7 | 10 | 3 | 8 |
| 10Mark | 94.4 | 98.3 | 87.8 | 97.1 | 8 | 10 | 10 |
GordStats is our simulation, FP the FantasyPros League Analyzer, FF The Fantasy Footballers' projected points per game (their points, not their grade-sorted rank).
Model Accuracy
Player accuracy
Correlation of projected with actual points per game, each season rebuilt from prior years only.
| 2023 | 2024 | 2025 | Average | |
|---|---|---|---|---|
| Position | ||||
| QB | +0.60 | +0.73 | +0.64 | +0.66 |
| RB | +0.66 | +0.81 | +0.82 | +0.76 |
| WR | +0.73 | +0.75 | +0.76 | +0.75 |
| TE | +0.62 | +0.70 | +0.75 | +0.69 |
Roster backtest
This page, run on past draft-day rosters: projected finish vs points actually scored.
Rank correlation: -0.07.
| Manager | Projected | Proj. Points | Actual | Actual Points | Wins |
|---|---|---|---|---|---|
| Trevor | 1 | 1,803 | 4 | 1,886 | 17 |
| Everett | 2 | 1,793 | 10 | 1,658 | 5 |
| George | 3 | 1,792 | 3 | 1,891 | 15 |
| Jackson | 4 | 1,775 | 2 | 1,943 | 19 |
| Austin | 5 | 1,764 | 8 | 1,776 | 16 |
| Padgett | 6 | 1,733 | 9 | 1,752 | 8 |
| Colin | 7 | 1,728 | 7 | 1,793 | 10 |
| Max | 8 | 1,728 | 1 | 1,983 | 19 |
| Tyler | 9 | 1,693 | 5 | 1,872 | 14 |
| Mark | 10 | 1,630 | 6 | 1,834 | 17 |
Average over 3 seasons: -0.12. Thirty team-seasons can't separate a good roster model from a coin flip; read the rankings as a measure of what was drafted, not a forecast.